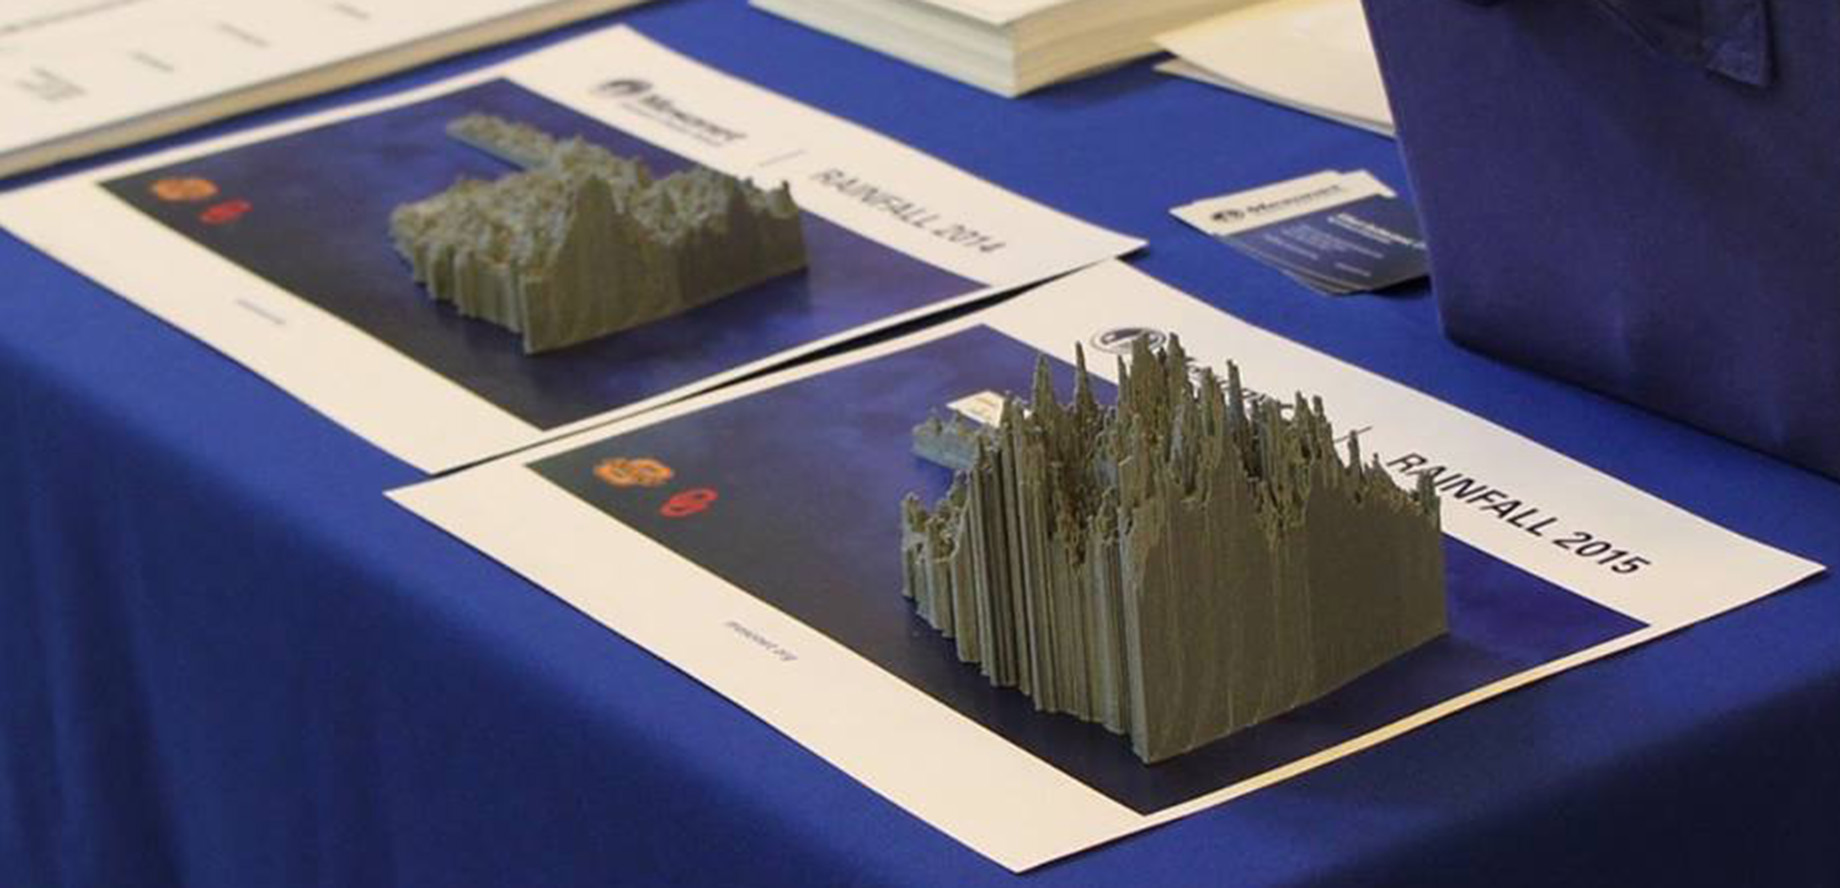
We created .stl files for use with 3D printers. We printed ours at 10% to avoid sharp peaks that could easily break off when handled often.
The files show annual rainfall amounts for the Oklahoma Mesonet sites combined with radar estimated rainfall. Similar to the 365-day Rainfall Accumulation map (except it is for a calendar year and not the previous 365 days).

Download Links
Labels for Rainfall Models
These labels were created using Avery Labels #94104. The labels include the statewide average for the year, the site with the minimum rainfall, and the site with the maximum rainfall. The labels fit nicely in the blank area under the Oklahoma Panhandle.
NASA Global Precipitation Measurement Precipitation Towers Base
A modified version of the 12-month stand and a version that includes a post for the yearly average used in the NASA Precipitation Towers. The posts are taller to support taller towers and the base has more room to allow for adding labels for each month in front of the posts. You can use Mesonet monthly precipitation data for a station near your school.
- Sample Worksheets (docx) for select Mesonet stations
- Worksheet Template (docx)
- Folder with Map files for each Mesonet site (PNG)
NASA Global Precipitation Measurement 3D Files
The NASA 3D Printed GPM Precipitation Data page includes links to .stl files for various past hurricanes, winter storms, and more.
Hail Size Models
We created .stl files for use with 3D printers to make models of standard sizes of hail used by the National Weather Service for official storm reports. File name includes approximate time to print the file.
Multiple stones in one file
Egg to Pea - file which groups several hail stones to be printed at the same time. This file prints hail stones from Pea (1/4" in or 6.35 mm) to Egg (2" in or 50.8 mm).